Exploring Population Dynamics Models using a GUI for R
Backstory
I recently taught a senior-level population dynamics course, and had to decide how best to get my students to be able to play around with the various models we were exploring in class. I ruled out using Excel right away and thought about using Mathematica because of its wonderful plotting capabilities and relatively-easy to learn syntax. However, I felt that it would be more trouble that it was worth to try to get either a site license for the students to be able to use the computers at school, as I had ruled out asking the students to purchase their own student copies. Being an avid R user, I had also thought about using R for the course but was concerned about the learning curve associated with it. I didn’t want students getting hung up on coding syntax, but rather, have an opportunity to explore different model parameterizations graphically.
Just before the course started, someone showed me the PBSmodelling package and I knew this could be the way to go. PBSmodelling makes it easy to construct a graphical user interface (GUI) for any function in R, in order to create a much more user-friendly interface with which to interact with computer models.
I took it upon myself to learn the basics of the PBSmodelling package, and I was able to create a fairly slick GUI to run a variety of population dynamics models in R and produce various types of plots in the process.
Disclaimer
This is still a work in progress, and I expect there to be minor bugs (mostly aesthetic I hope!), but I think I’m off to great start.
Requirements
Operating Systems:
- Windows: XP, Vista, 7
- Mac OSX*: 10.5, 10.6
- Linux**: Ubuntu 10.04, 10.10, 11.04
R must be installed
- see http://cran.r-project.org/
- the following packages are also required:
PBSmodelling,deSolve,scatterplot3d
*OSX doesn’t come with X11 and tcltk installed by default:
- install X11 ( http://support.apple.com/kb/DL641)
- install the update ( http://support.apple.com/kb/DL304)
- restart your computer
- install tcltk for R ( http://cran.stat.sfu.ca/bin/macosx/tools/tcltk-8.5.5-x11.dmg)
- open R and select package installer from the menu
- in the R package installer window, search “tcltk”
- this returns two results:
tcktl2andgWidgetstcltk - select both and be sure to check the “install dependencies” box.
** Ubuntu users may need to install tcl/tk:
sudo apt-get install tcl tk
Getting Started
- download my population dynamics modelling gui code, and unzip the contents
- open R from the models_GUI directory
- load the default workspace (
models_GUI/.Rdata) - press the up arrow key to recall previous commands saved in the workspace:
a. source("407.SSG.models.R") loads the single species growth models interface
b. source("407.MSG.models.R") loads the multi-species growth models interface
c. source("407.disease.models.R") loads the disease (SIR) models interface
d. source("407.num.approx.R") loads the numerical approximation interface
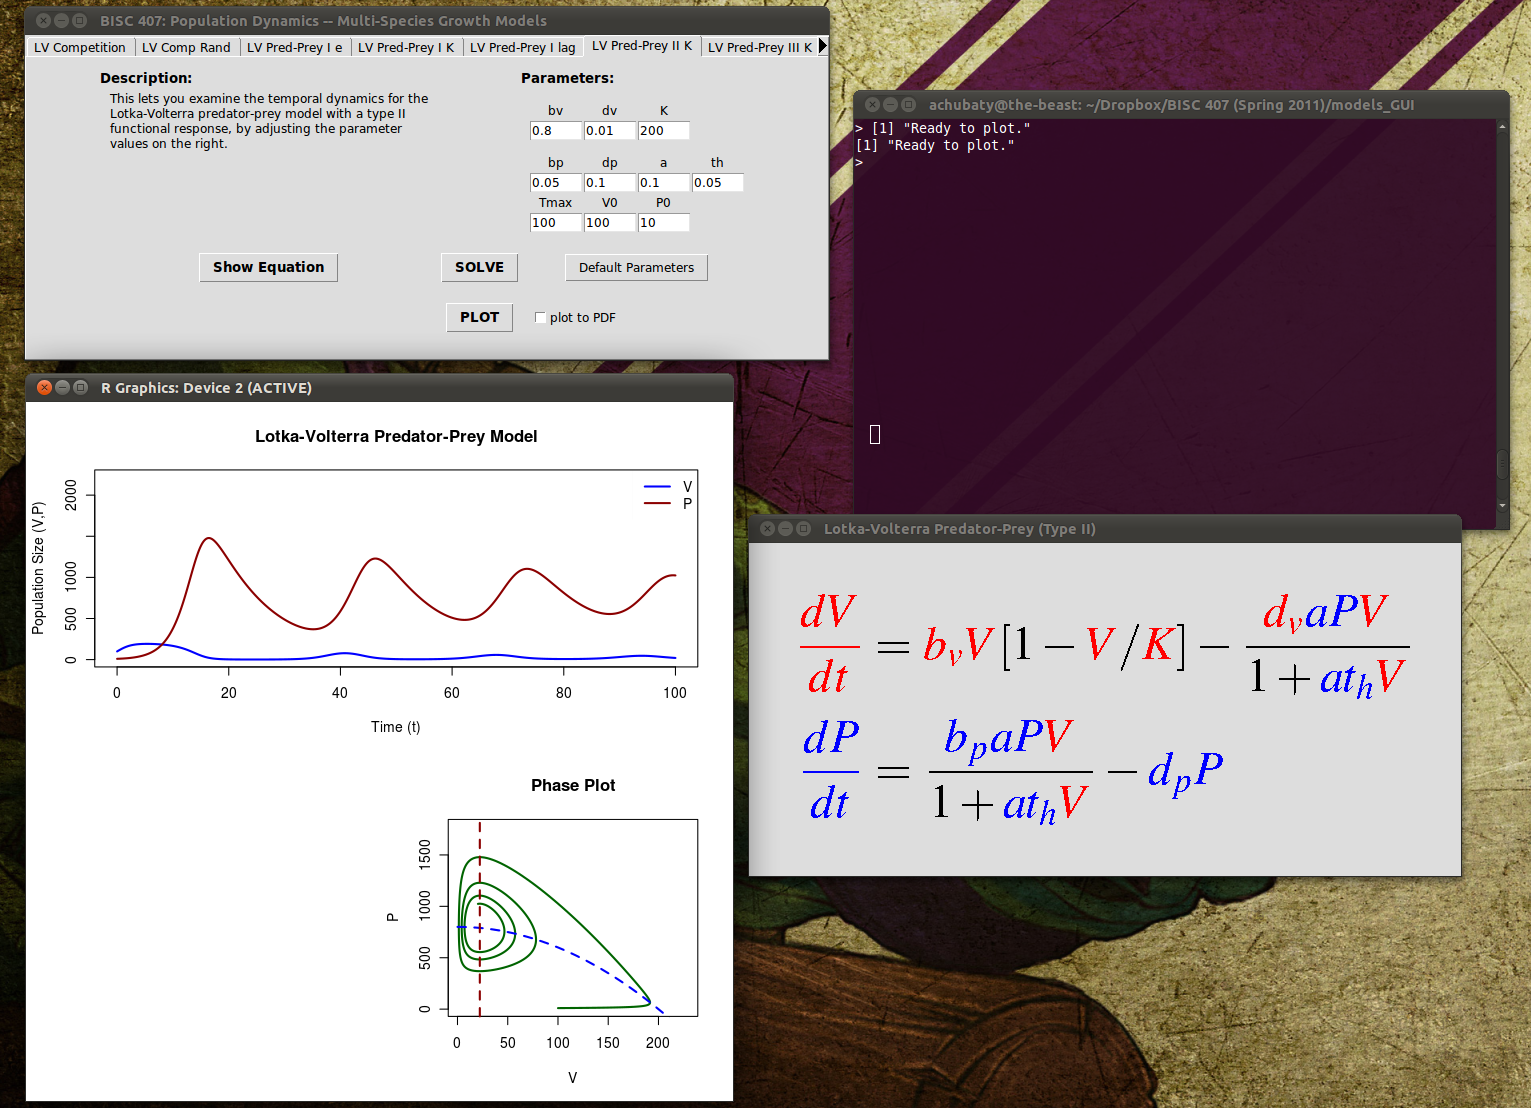
- use the tabs along the top of each interface to select model type
- to view equations used, press ‘Show Equation’ button
- parameter values can be changed by editing the fields
- solve the model using current parameter values by pressing ‘Solve’
- after solving, plot the model results by pressing ‘Plot’ (note you can plot to a PDF device by checking the box ‘plot to pdf’)
Download
Link: models_GUI_2011-08-07